
![]()
| Home | NPP Products | LIDAR | Frequently Asked Questions |
| Site Map | Land / Ocean Merge | Field / Lab Data | Highlights / Results |
![]()
|
|
||||||||
|
|
||||||||
|
|
||||||||
|
||||||||
|
|
Welcome to the Ocean Productivity Home Page
The purpose of this website is, first and foremost, to provide the science and broader communities with global, updated ocean productivity estimates. In addition, the website provides information on the models employed, access to model code and ancillary data sets, and comparisons of productivity estimates for alternative models. Field data sets relevant to ocean productivity modeling are also provided and will be continually expanded as new data become available. Educational material and background information on phytoplankton ecology and physiology will also be added in the future. For those of you familiar with the site, either use the menu bar above to navigate to your desired page, or use the site map. However, if you are new here, please look over the following to help you find what you are looking for. For the non-specialist (and others) the Standard VGPM might be just what you need if you are looking for ocean productivity data. For more specialist applications where you want to compare or use productivity products from different models (Standard VGPM, Eppley VGPM, CBPM2 and CAFE) or sensors (SeaWiFS, MODIS, and VIIRS). Please refer to the NPP Products path for online data. Standard ProductsCommunity guidance for developing this website was to provide a single productivity product as a Standard product. For this, we initially chose the original Vertically Generalized Production Model (VGPM) (Behrenfeld and Falkowski, 1997a) as the standard algorithm. The VGPM is a "chlorophyll-based" model that estimate net primary production from chlorophyll using a temperature-dependent description of chlorophyll-specific photosynthetic efficiency. For the VGPM, net primary production is a function of chlorophyll, available light, and the photosynthetic efficiency. Shown below is an example of VGPM-based global ocean net primary production for November of 2007 . Standard products are based on chlorophyll, temperature and PAR data from SeaWiFS, MODIS and VIIRS satellites, along with estimates of euphotic zone depth from a model developed by Morel and Berthon (1989) and based on chlorophyll concentration. Monthly global ocean production for November 2007 was 3.68567 Pg (1 Pg = 10**15 g.) | ||||||||||||
Monthly Net Primary Production: November
, 2007
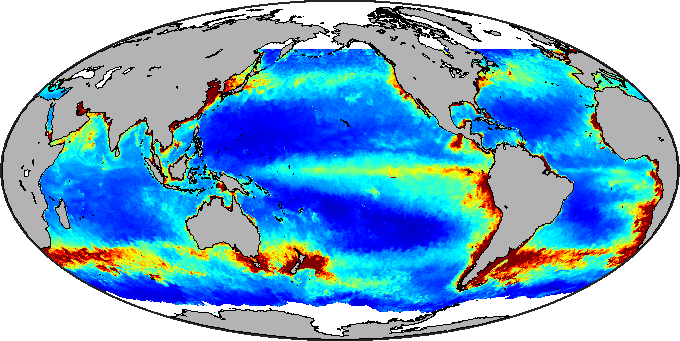  Standard Product: Net Primary Production using MODIS CHL SST, PAR, and z_eu = f(CHL) as inputs to the VGPM |
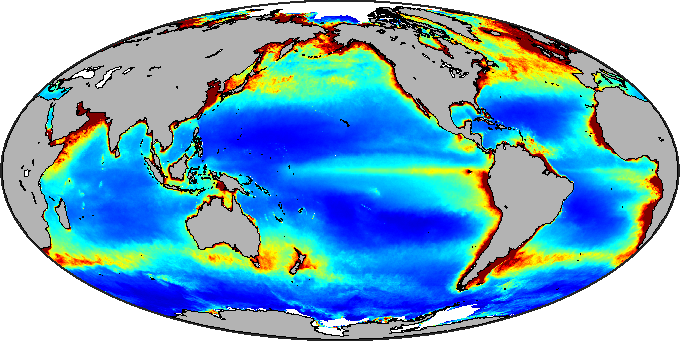
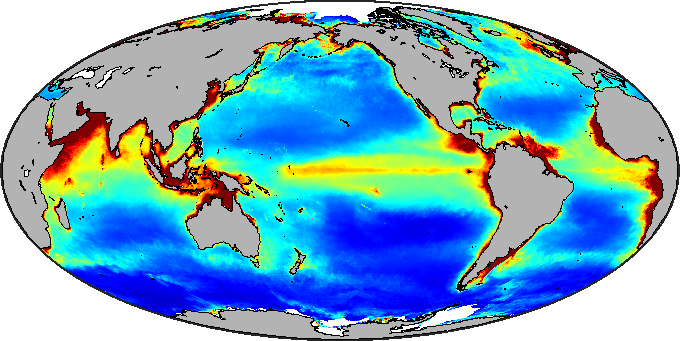
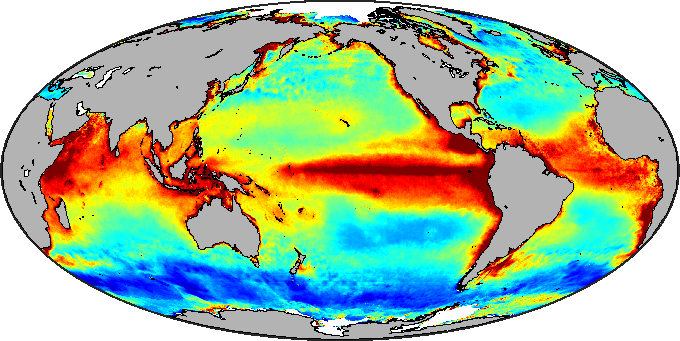
Alternate NPP ProductsThe NPP Products path provides ocean productivity estimates for different satellite data sets, for 'standard' and 'alternative' productivity algorithms. Currently, the three alternative algorithms are (1) an "Eppley" version of the VGPM, (2) an updated version of the Carbon-based Production Model (CbPM2) (Behrenfeld et al. 2005, Westberry et al. 2008), and (3) the absorbtion-based CAFE Model (Silsbe et al, 2016). Examples of annual total productivity for the Standard VGPM, the Eppley-VGPM, and the CbPM2 are shown below to illustrate the rather significant differences between models. Additional comparisons on shorter time scales can be viewed on the NPP Products visual comparison page. Eppley-VGPMThe only difference between the Standard VGPM and the Eppley-VGPM is the temperature-dependent description of photosynthetic efficiencies. As the name implies, the Eppley-VGPM uses an exponential function that is traceable to a paper by Richard Eppley (1972). In that paper, Eppley evaluated changes in phytoplankton growth rates over a range of temperatures for a wide variety of species. What he noticed was that the maximum specific growth rate achieved at a given temperature was higher at high temperatures than at low temperatures. He then fit an exponential curve to this data that capped all the growth rates across the measured temperature range. While Eppley's analysis has no direct relationship to the description of average photosynthetic efficiencies, its application in ocean productivity models is commonplace. While this may seem rather unfounded, there actually is a good reason why an exponential function may give reasonable estimates of photosynthetic efficiencies -- that reason is photoacclimation. Photoacclimation is a process found in all ocean and land plants that allow them to adjust to changes in light level. When plants are grown at low light, they have a lot of pigment to help them gather as much light energy as possible. If you transfer the same plants to high light, they quickly reduce the amount of pigmentation to prevent damage from absorbing too much light. If you were to measure the photosynthetic efficiency per unit of pigment under low and high light conditions, you would find that the high light treatment had the highest efficiency. How is this photoacclimation process related to satellite estimates of net primary production? Simple, if you look at the global average relationship between surface ocean temperature and the average light phytoplankton in these surface waters experience, you will find that warm water phytoplankton generally experience higher light levels than cold water phytoplankton -- in other words, you would expect higher photosynthetic efficiencies in the warmer water. The Eppley curve provides a generic description of this basic phenomenon. The exact "Eppley" function we've applied to the VGPM is based from the productivity model of Morel (1991). In that paper, he normalized the original Eppley curve to give a photosynthetic efficiency of 4.6 milligrams of carbon fixed per milligram of chlorophyll per hour at a sea surface temperature of 20 degrees Celsius. When this version of the Eppley curve is applied to the VGPM, the resultant global fields on net primary production compare extremely well with estimates from the far more sophisticated productivity model described by Antoine and Morel (1996) and based on the original work of Morel (1991). The similarity between these models is described more extensively in a paper by Elena-Carr et al (2006), which reports results from a recent intercomparison of productivity algorithms.
Carbon-based Production Model (CbPM)Nearly all models of aquatic photosynthesis use chlorophyll concentration as the metric of phytoplankton biomass. New chlorophyll-based algorithms have appeared in the literature on average at least once very two years for the past 50 years, but to first order they all represent a modification to or expansion upon the early work of Ryther (1956), Ryther and Yentch (1957), and Talling (1957). A review and comparison of these models is provided in Behrenfeld and Falkowski (1997b). In 2005, we introduced a very different approach to productivity modeling that uses remote sensing retrievals of particulate scattering coefficients to estimate phytoplankton carbon concentration, thus replacing chlorophyll as the metric of biomass (Behrenfeld et al. 2005). This new approach was made possible by two recent developments: (1) the observation that total particulate carbon concentration or phytoplankton biomass covaried with light scattering properties ( Loisel et al. 2001, Stramski et al. 1999, DuRand and Olsen 1996, Green et al. 2003, Green and Sosik 2004, Behrenfeld and Boss 2003, 2006b) and (2) the construction and application of spectral matching algorithms to satellite data for simultaneously retrieving information on particulate backscattering scattering coefficients, phytoplankton pigment absorption, and colored dissolved organic carbon absorption ( Garver and Siegel,1997; Maritorena et al., 2002; Siegel et al., 2002). The importance of these two developments is that they allowed phytoplankton carbon biomass to be estimated from backscattering coefficients and phytoplankton growth rates to be estimated from chlorophyll-to-carbon ratios -- thus net primary production is described as the product of carbon biomass and growth rate, rather than the traditional product of chlorophyll and photosynthetic efficiencies. This is why we refer to the model as the CbPM. The original CbPM ( Behrenfeld et al. 2005) used attenuation coefficients at 490 nm to estimate photic zone depths, although it was recognized that this approach leads to overestimates of water column production. In the NPP Product path, you will find CbPM production values that are instead based on euphotic depths calculated using the same chlorophyll-based model of Morel and Berthon (1989) as applied in the two VGPM models. This allows more direct comparisons between the alternative production algorithms. However, you should note that the two VGPM products are based on SeaWiFS and MODIS Standard chlorophyll products, while the CbPM uses products from a spectral matching algorithm. In the near future, we will be posting a new set of CbPM model results that employs a greatly refined algorithm that spectrally characterizes the underwater light field and accounts for nutrient- and light-dependent changes in phytoplankton physiology with depth. This new models is described by Westberry et al. (2008).
Other ModelsPlease see the NPP Products page for more information and data from the various models. |
|
|
|