ΔG° = ΔH° - TΔS°
This relates the enthalpy change ΔH°, mostly changes in bond strength, and the entropy change ΔS°, "disorder" (represented by the number of particles, symmetry, and rotational freedom) to an overall energy change called Gibbs free energy, ΔG°. This latter energy measure can be related to an observable quantity, the equilibrium constant Keq through the following equation:
ΔG° = -RTlnKeq
The more negative ΔG°, the larger is Keq; the more positive ΔG°, the smaller is Keq.

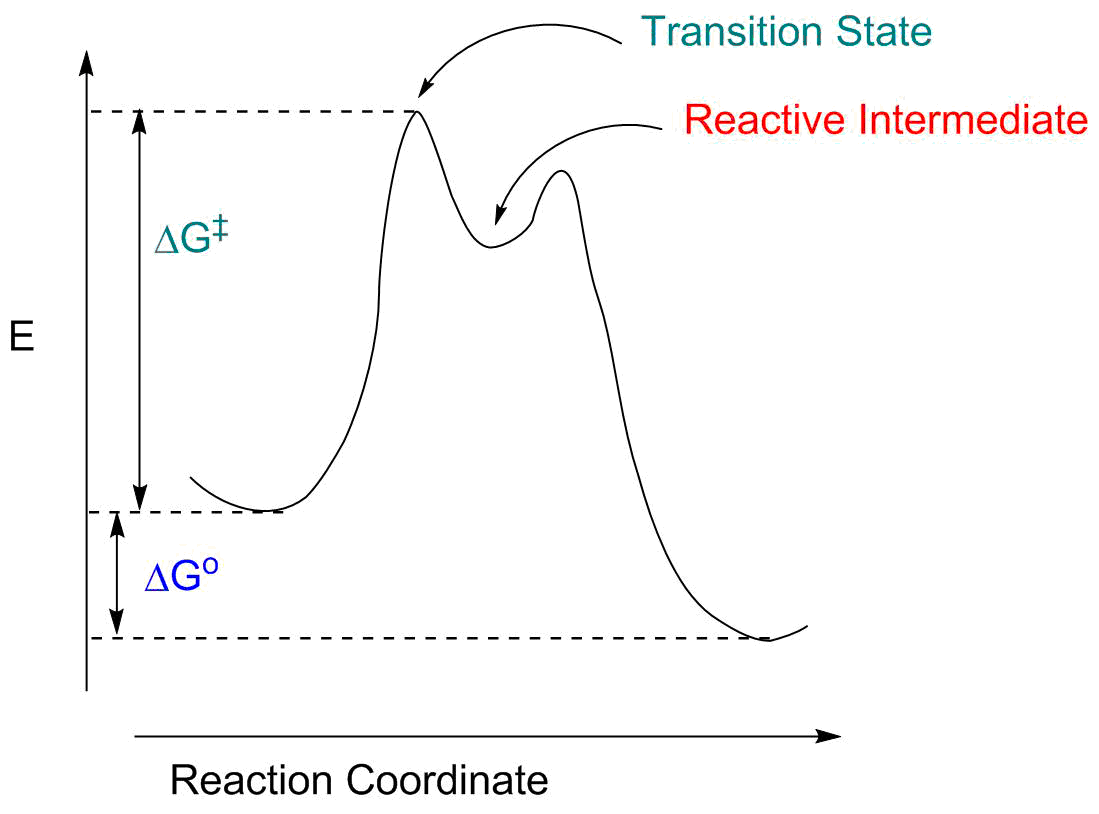
- The "reaction coordinate" (the X axis) is the collection of bond length, bond angle and torsional angle changes required for the reaction. For something like breaking the Cl-Cl bond in Cl2, this is pretty simple: it's the Cl-Cl distance. For a more complex reaction it will involve a large number of structural parameters.
- The reaction is exothermic; ΔG° is negative.
- There is an energy barrier to the reaction, represented by ΔG‡. This means we have to give the molecule extra energy to perform the transformation. This energy might be readily available (at room temperature, if ΔG‡ is fairly small) or we may have to heat the system (if ΔG‡ is large).
- The "transition state" is the energy maximum; it represents an intermediate structure between reactants and products. It exists for only an infinitessimal amount of time; it most closely resemples whatever structure is nearby both along the reaction coordinate and in energy.
k = (𝓀T/h)e-ΔG‡/RT
where k is the rate constant, 𝓀 and h are physical constants (Boltzmann's and Planck's, respectively), R is the gas constant, and T is temperature. This a small ΔG‡ leads to a large rate; a big ΔG‡ leads to a small rate. The rate constant increases with temperature, but in a complex fashion (T appears twice).We also have to be aware of the distinction between reaction rate and the rate constant. The expression for the rate depends on both the rate constant k and (potentially) the concentrations of any of the reactants:
Rate = k[A]n[B]m...
for the reaction nA + mB + ... → products. The rate is changed either by changing the rate constant or by changing the concentrations of reactants. When investigating a new reaction we normally hold the concentrations constant as we vary structure (to see the impact on ΔG‡) but often the dependence of the rate on reactant concentration is a major clue to the mechanism.