|
Temporal and Spatial Variability of Groundwater Nitrate in the Southern Willamette Valley of Oregon |
||
|
Mutti Home
|
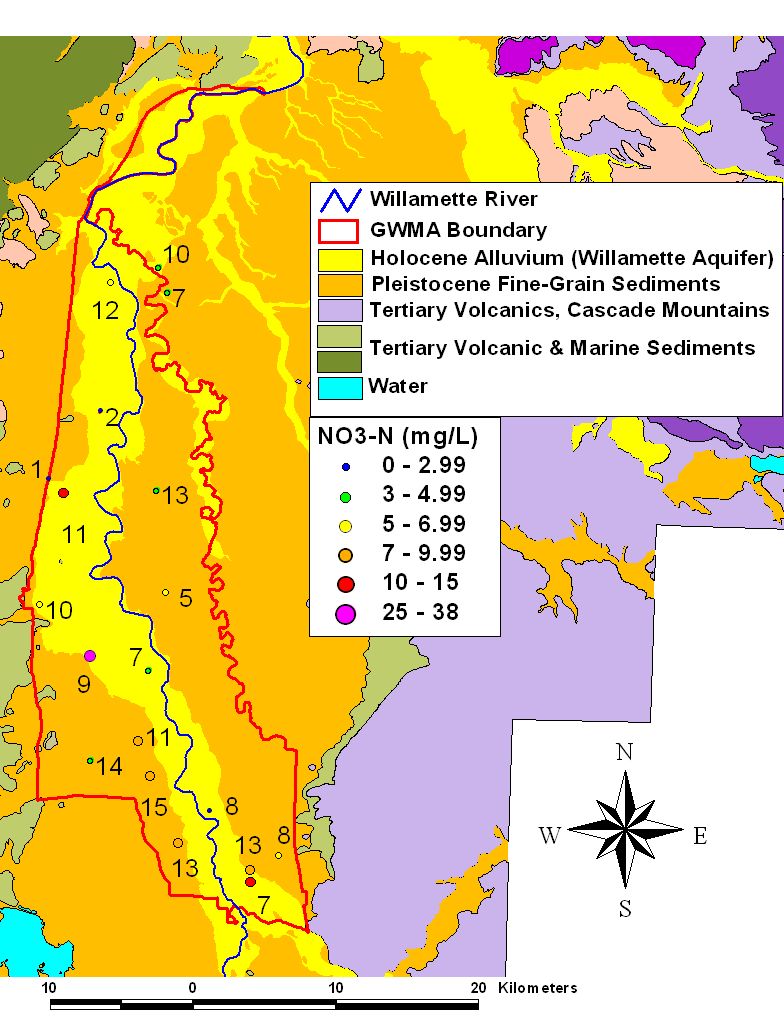
Maps showing monthly groundwater nitrate concentrations for sample sites and their intra-well ranking are available below. A rank value (shown as the well label) of 1 indicates that the highest observed nitrate concentration for the well was made that month. High rank values indicate that observed well concentration was relatively low in a given month. The geologic map in the figures is from Gannett and Caldwell (1998). All files are .jpg images. | |
|
||
|
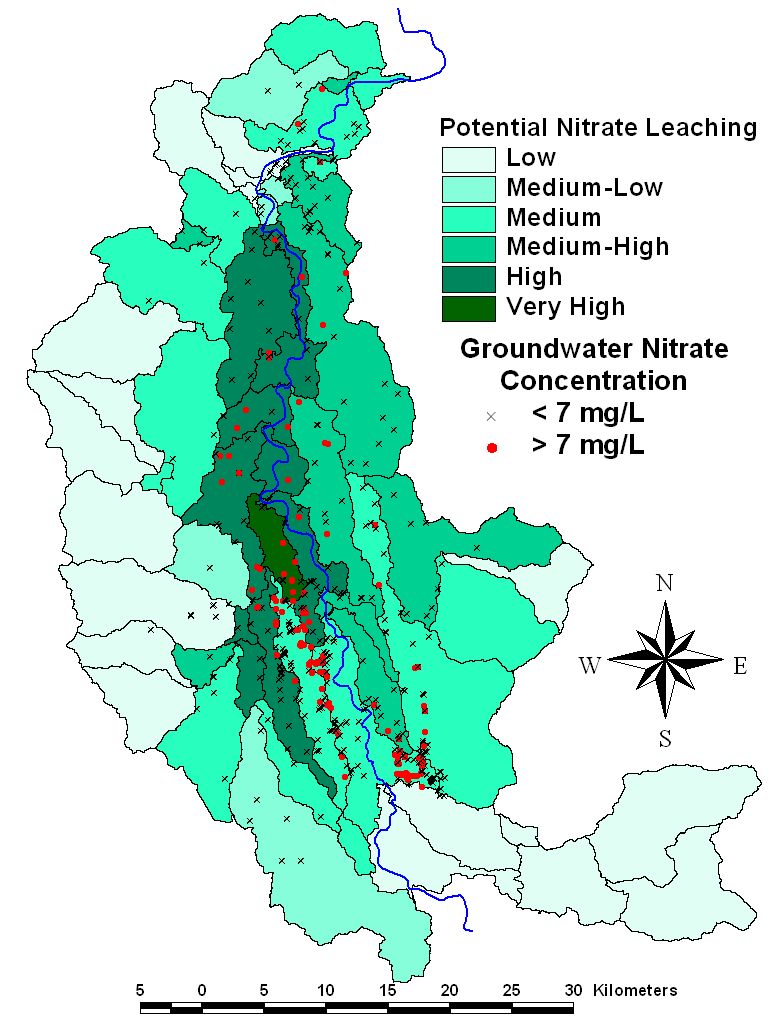
Modeling of potential nitrate leaching was done using the Soil and Water
Assessment Tool (SWAT).
Output data compared with groundwater nitrate data indicates that SWAT
reasonably models nitrate leaching, as shown
here. Regions where discrepancies exist
between modeled and observed data are in the south-central portion of
the modeled area (between Coburg and Junction City) and are caused
by the current model's inability to account for septic loading.
|
||
| Gannett, M.W., Caldwell, R.R., 1998, Geologic Framework of the Wilamette Lowland Aquifer System, Oregon and Washington: USGS Professional paper 1424-A, 32 p. | ||